
Reports on your data, shared with each client
Build a report by describing it, share it into the portal and every client sees the same report filtered to their own rows.
Reports is included on every plan for a limited time.
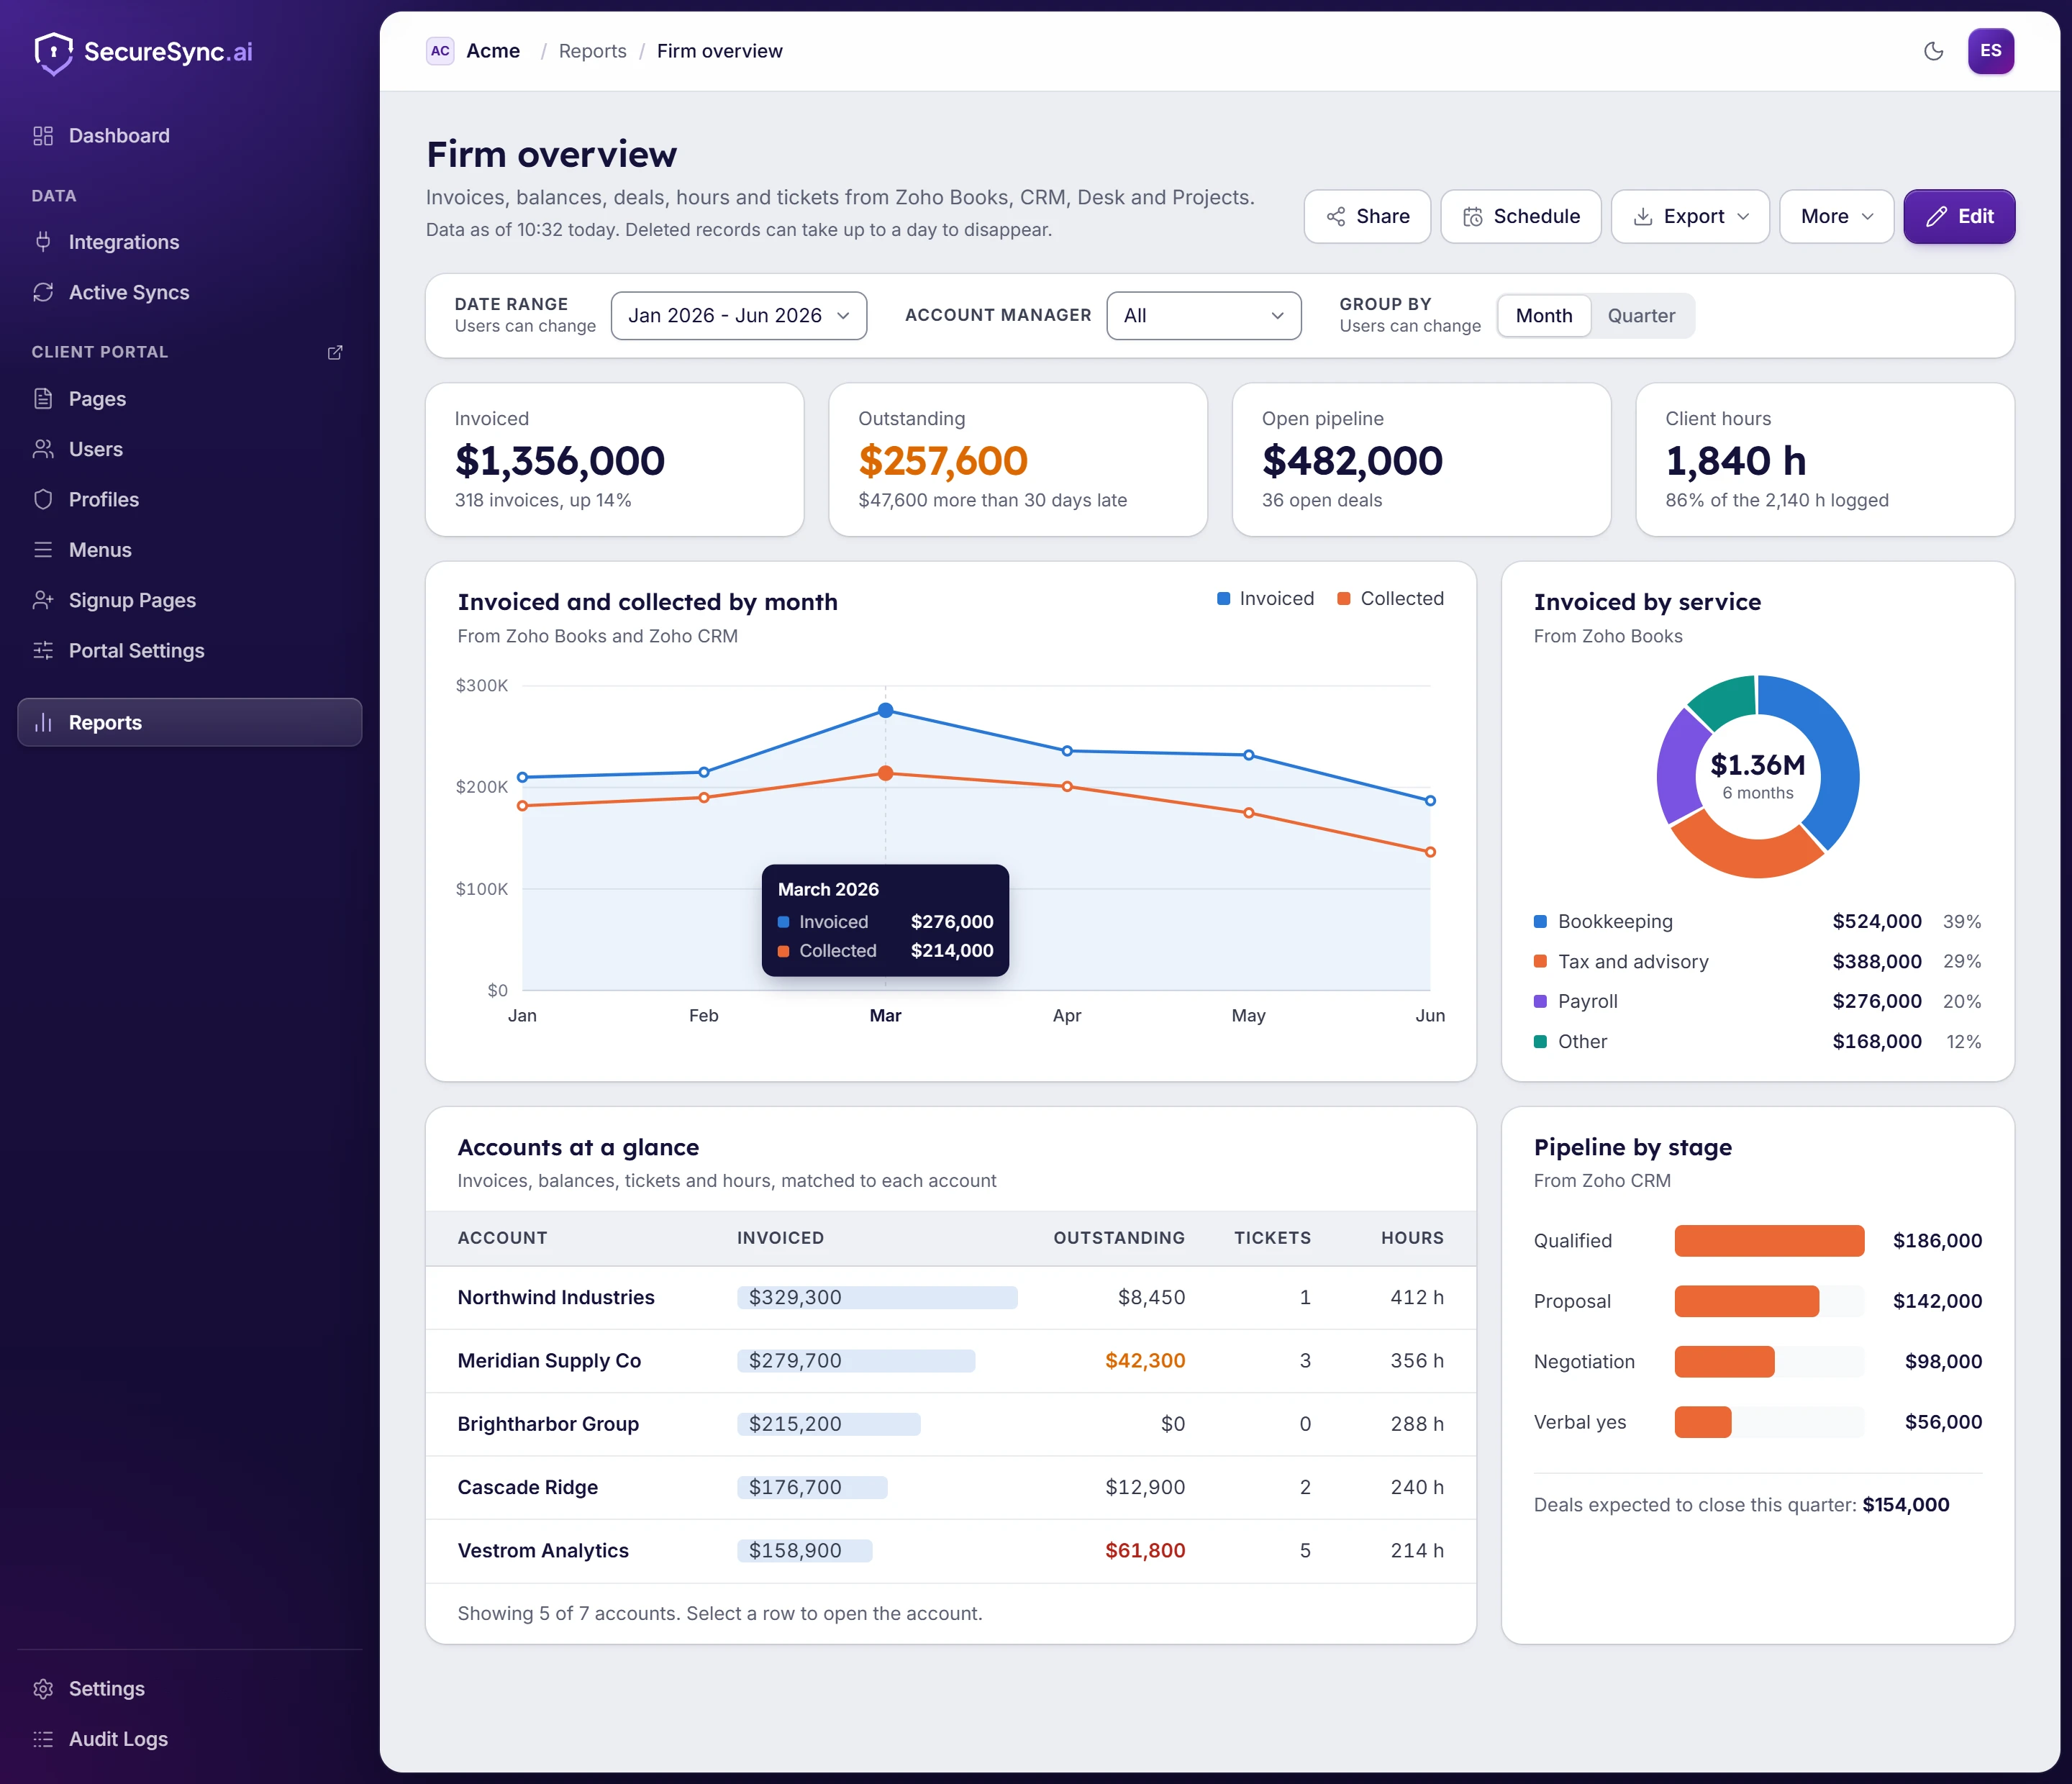
One dashboard across CRM, billing, projects and support
Invoices live in one app, deals in another and tickets in a third. A report reads all of your synced data at once, so one dashboard can hold totals, line, bar and pie charts, summary tables and lists from every connected app, with the filters your readers can change at the top.
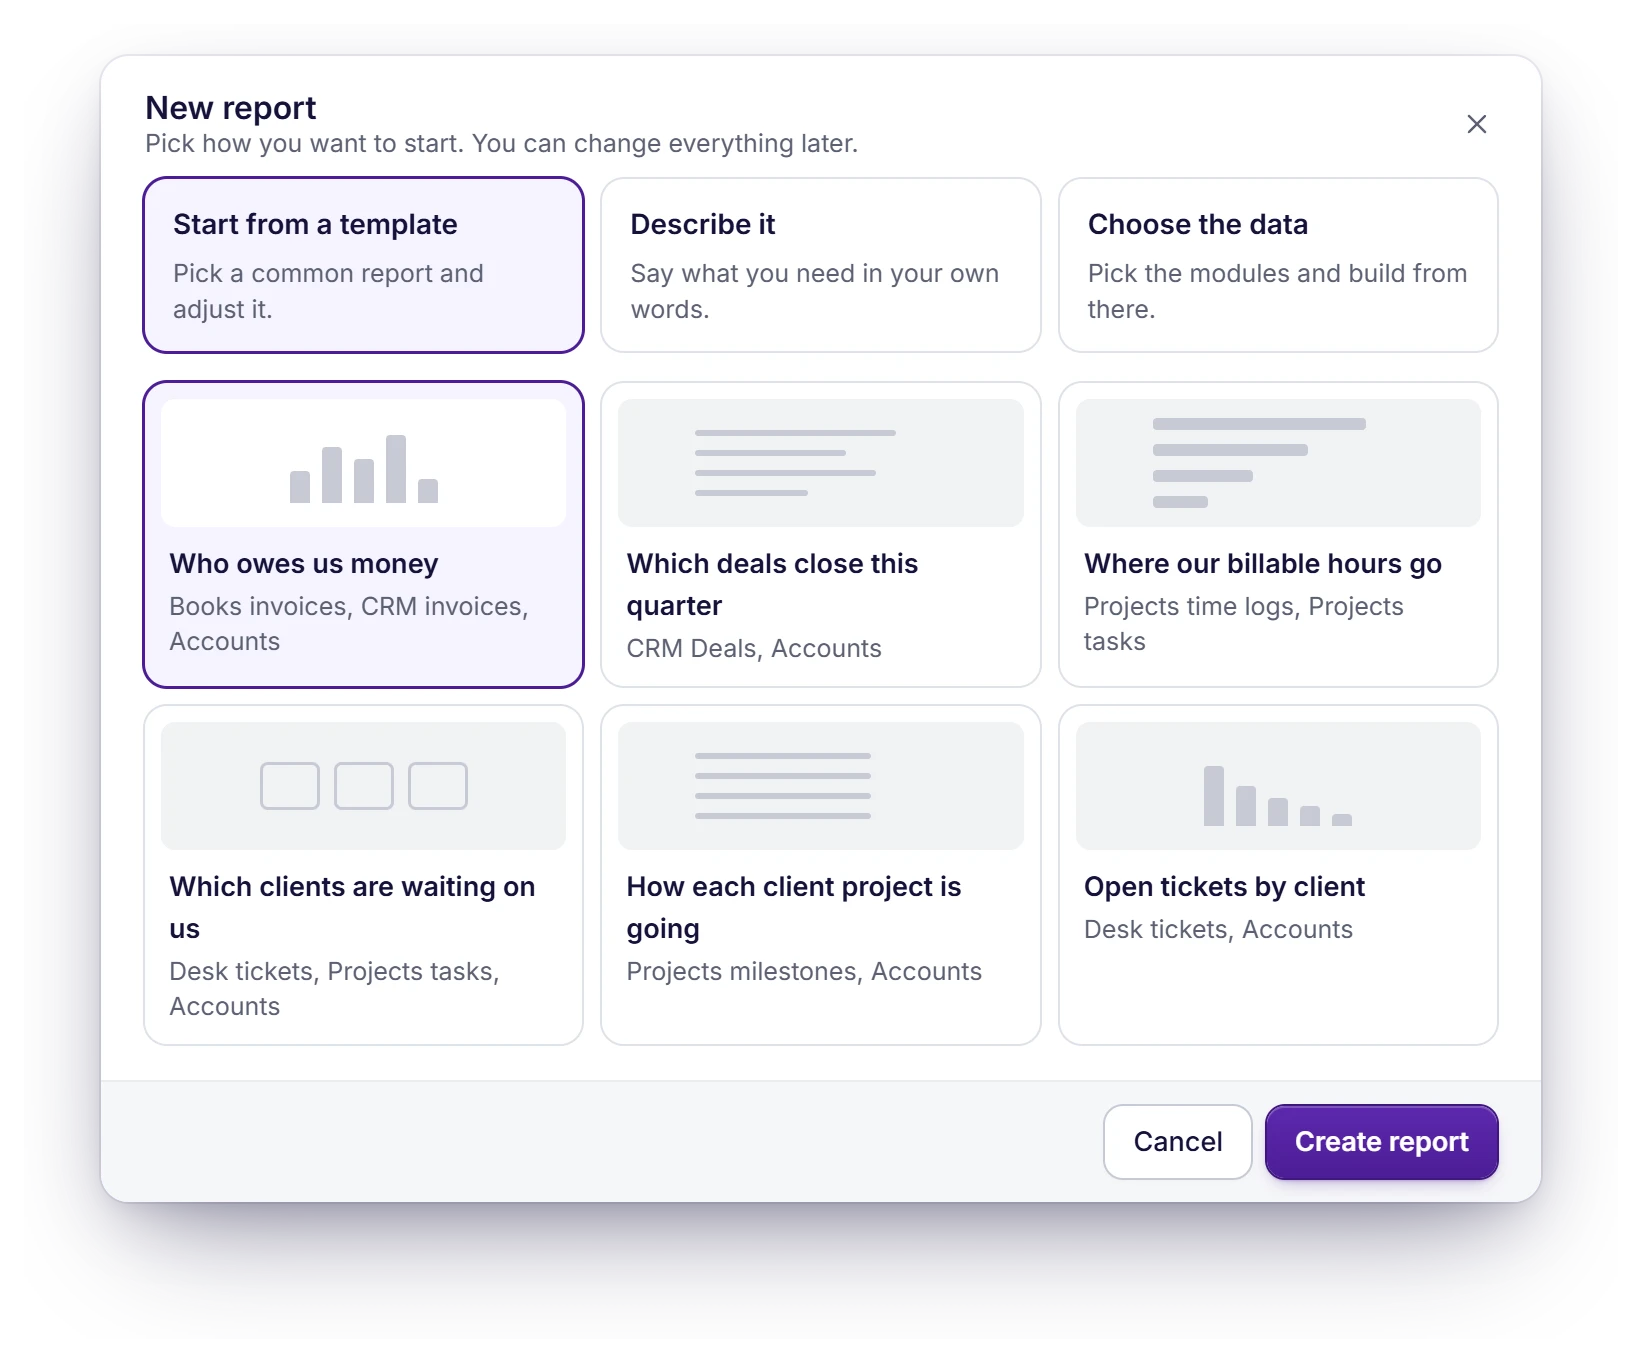
Start from a template, a sentence or your data
Twenty templates are built in, five each for Zoho CRM, Books, Desk and Projects, named by the question they answer. Or describe the report in a sentence and the AI builds a first version, or tick the data you want and build it yourself. All three open in the same builder.
- Only templates for the apps you've connected are offered
- A template matches your own modules and fields by name
- Save any report as a template of your own
Describe it, or click it together
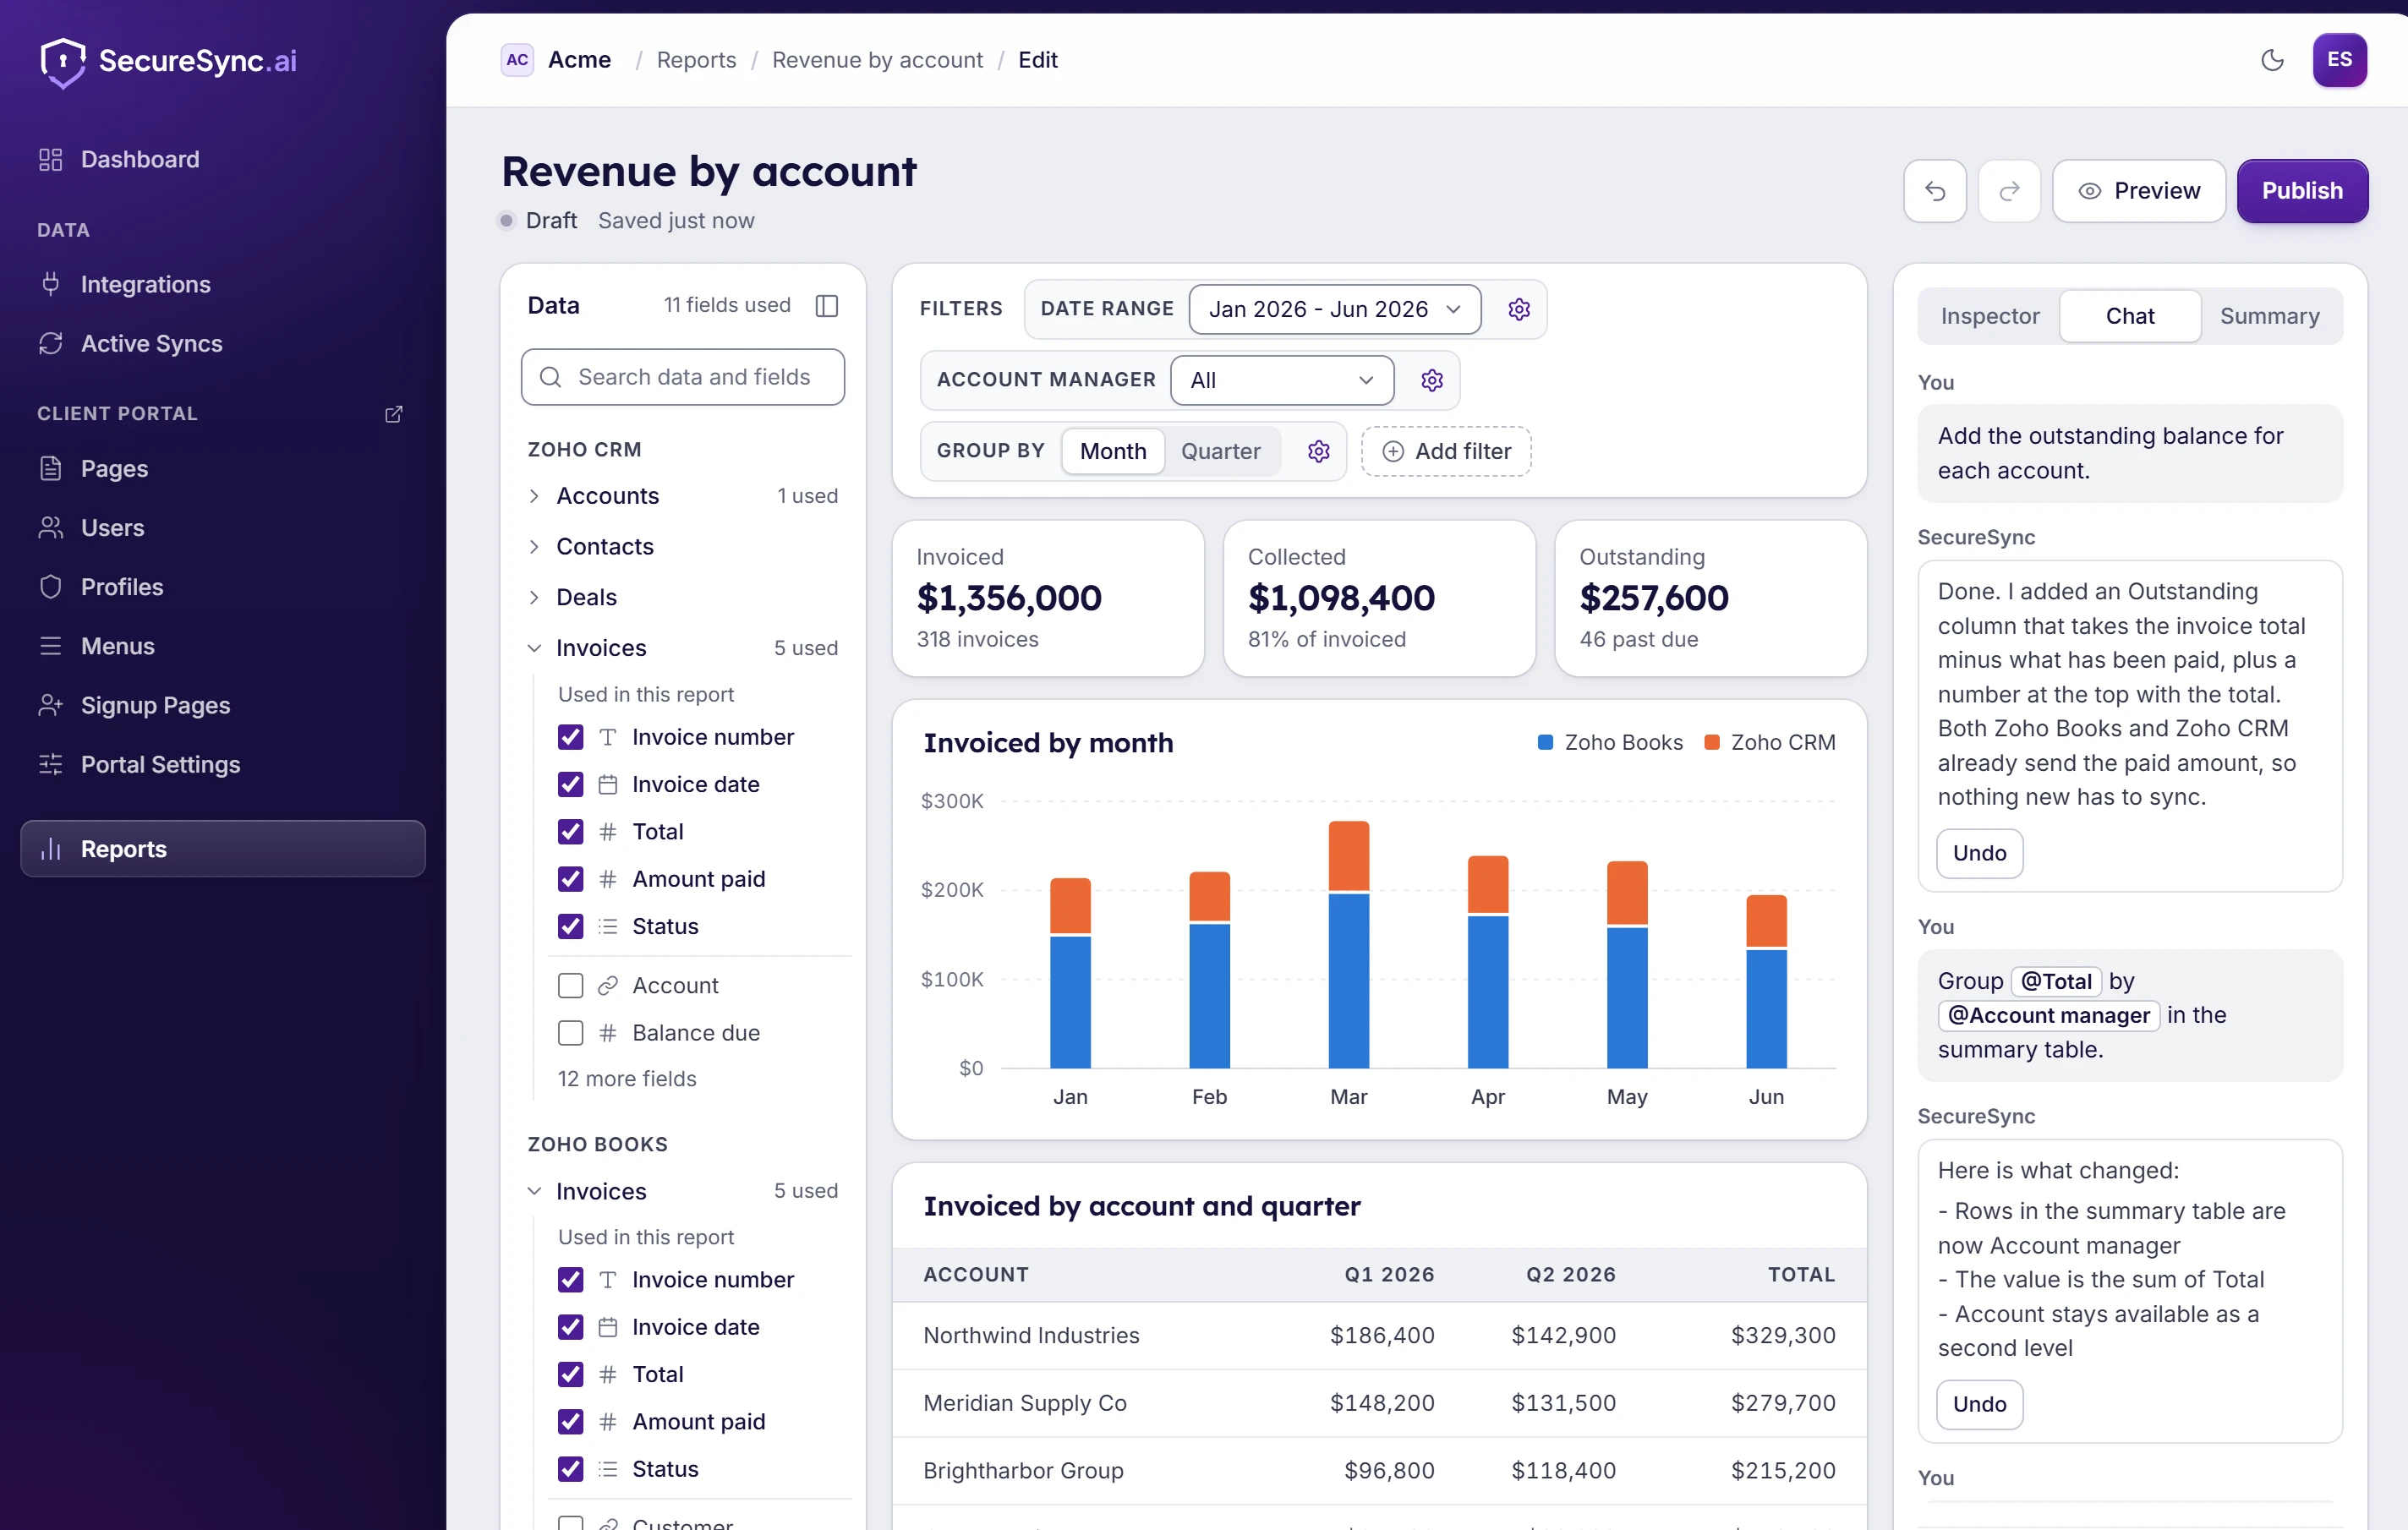
Describe what you want and the chat changes the report, or tick fields and set the filters, grouping and sort yourself. Each change the chat makes is listed in plain language with an undo. You work on a draft, readers keep seeing the published version until you publish, and every version is kept so you can go back.
Link and combine data across apps
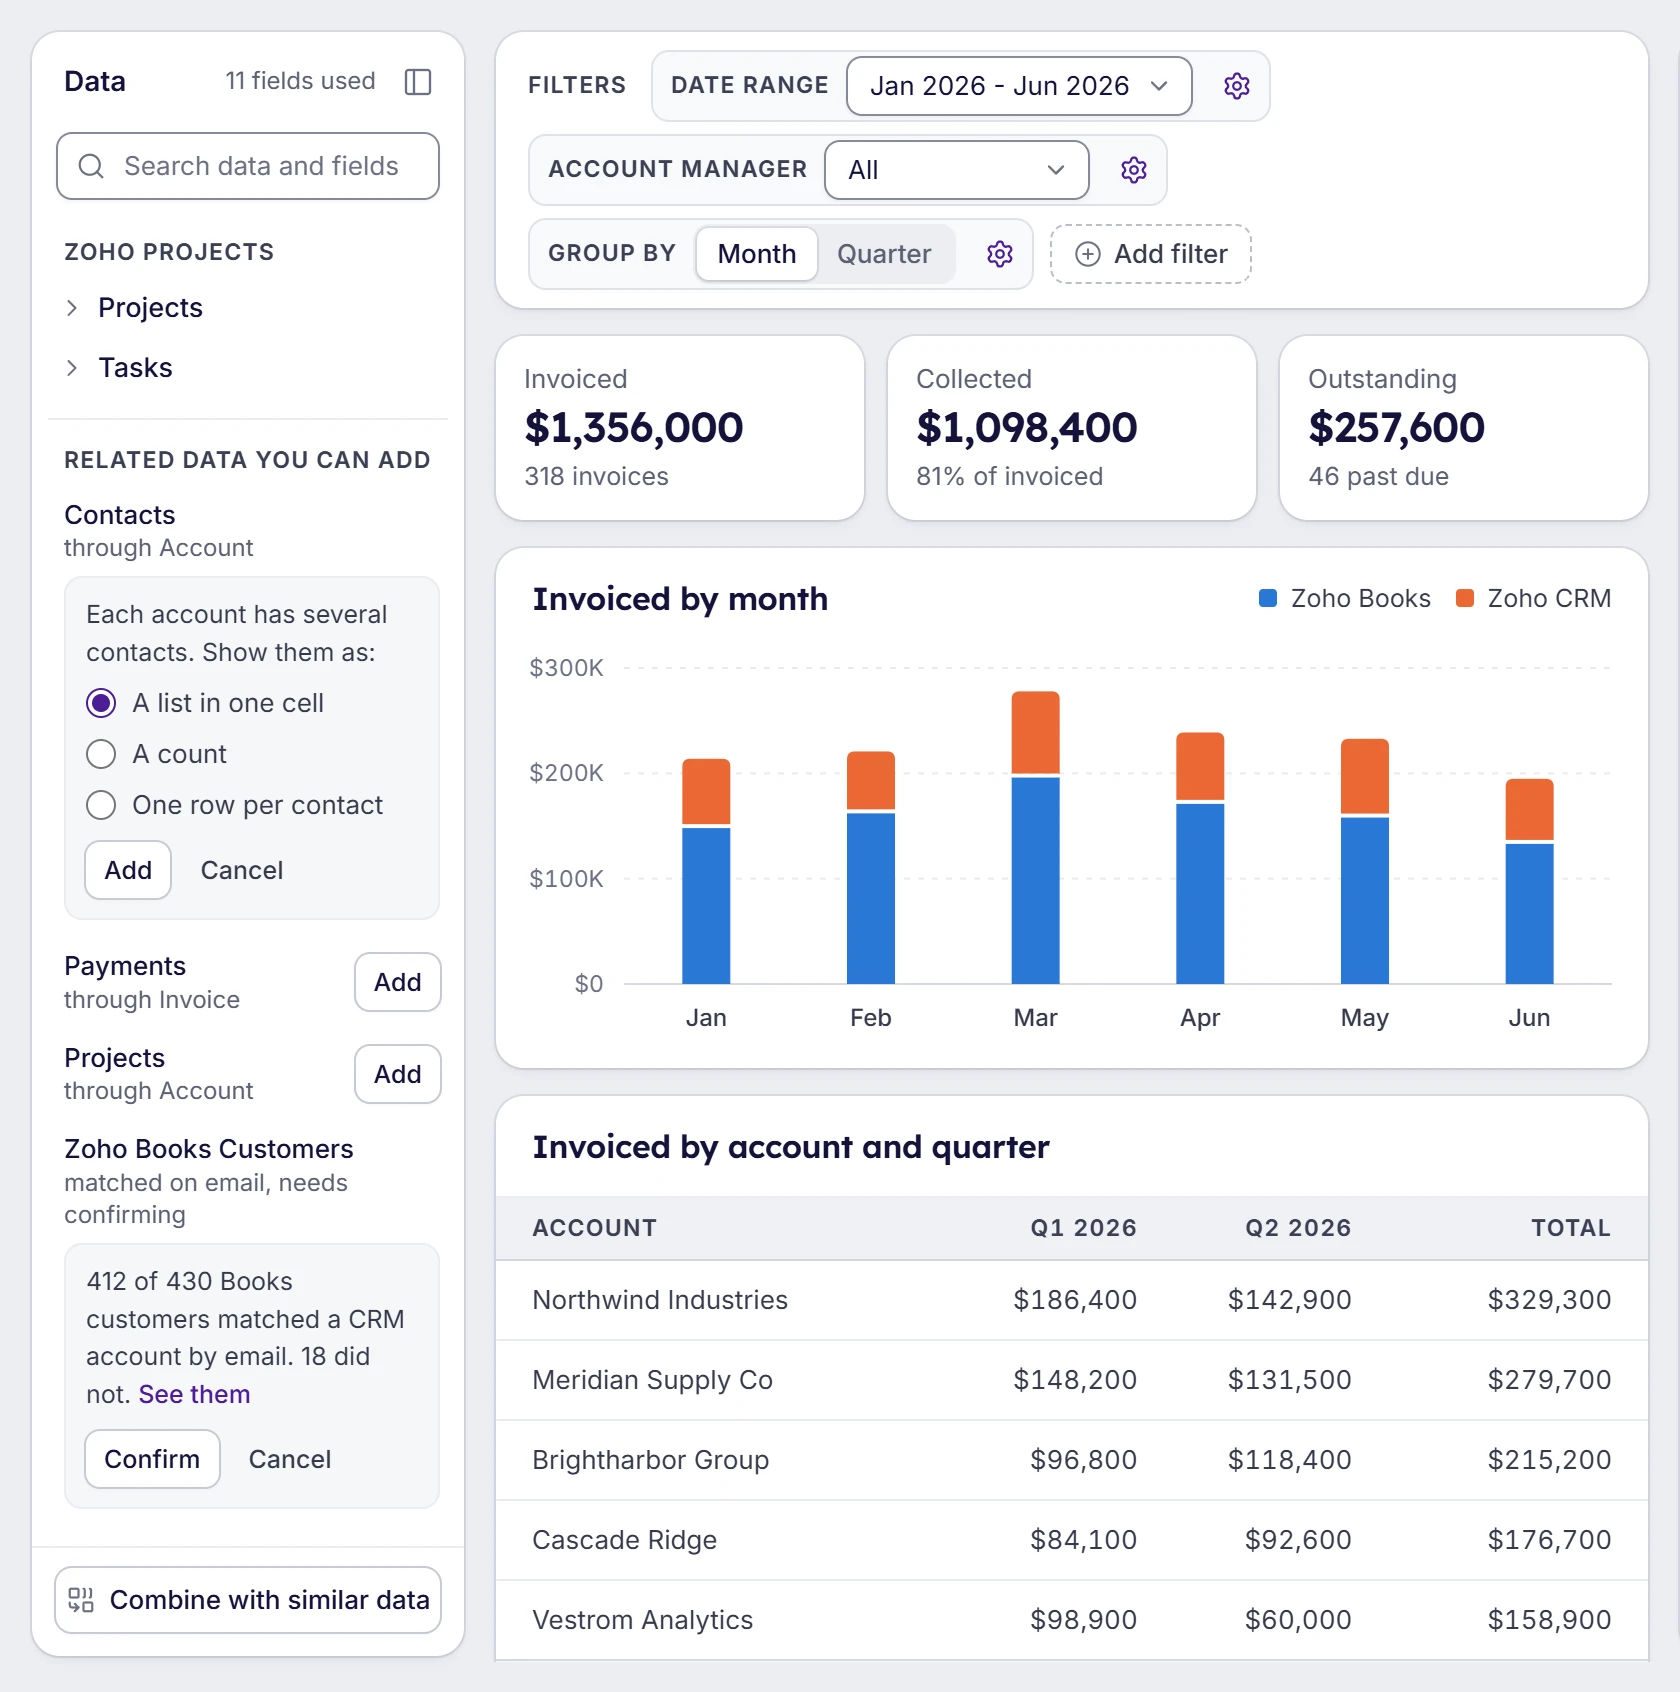
Bring in related records through the links your apps already have, such as an account's contacts or an invoice's payments. Where two apps only share an email, you see how many records match before you confirm the link.
- Related records as a list, a count or one row each
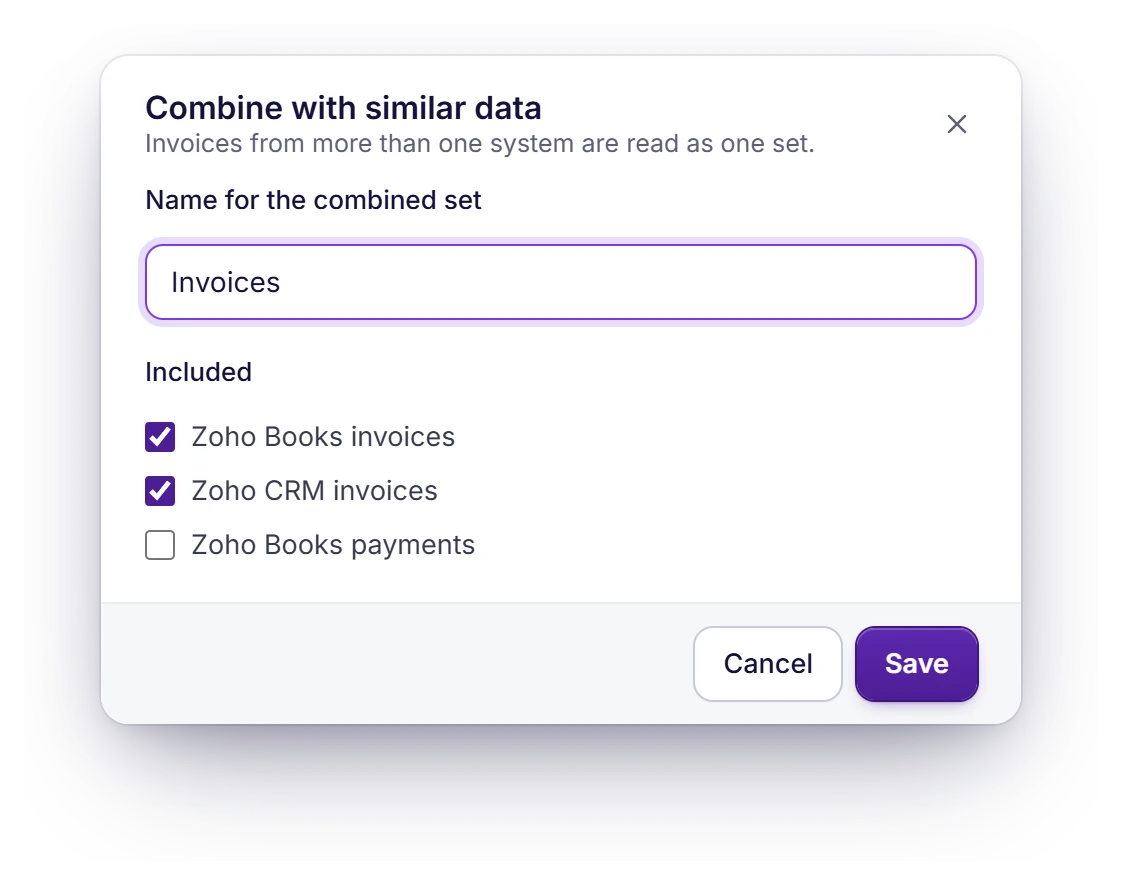
- Zoho Books and Zoho CRM invoices read as one set
- Calculations from presets such as days since a date, or your own formula
Share to the portal, scoped per client
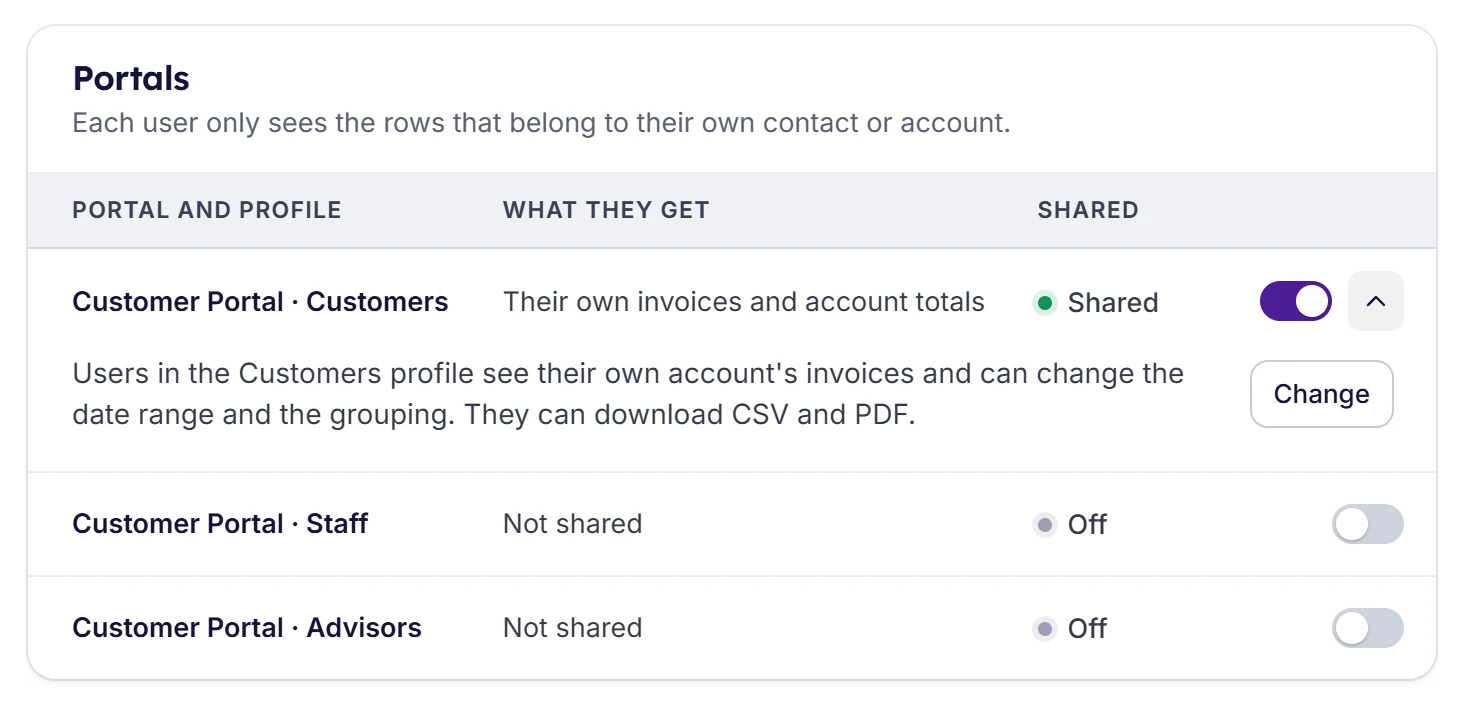
Share a report to a portal and choose, for each source, whether a client sees their account's records, their contact's records or everyone's. Lock the filters that must not change, hide the columns they shouldn't see and preview the result as any user before it goes live.
- Each client sees only their own rows, and can't change the filters you lock
- Different filters and hidden columns for each type of client
- If a client's records can't be worked out, the report shows them nothing and tells you
Reports your clients can actually explore
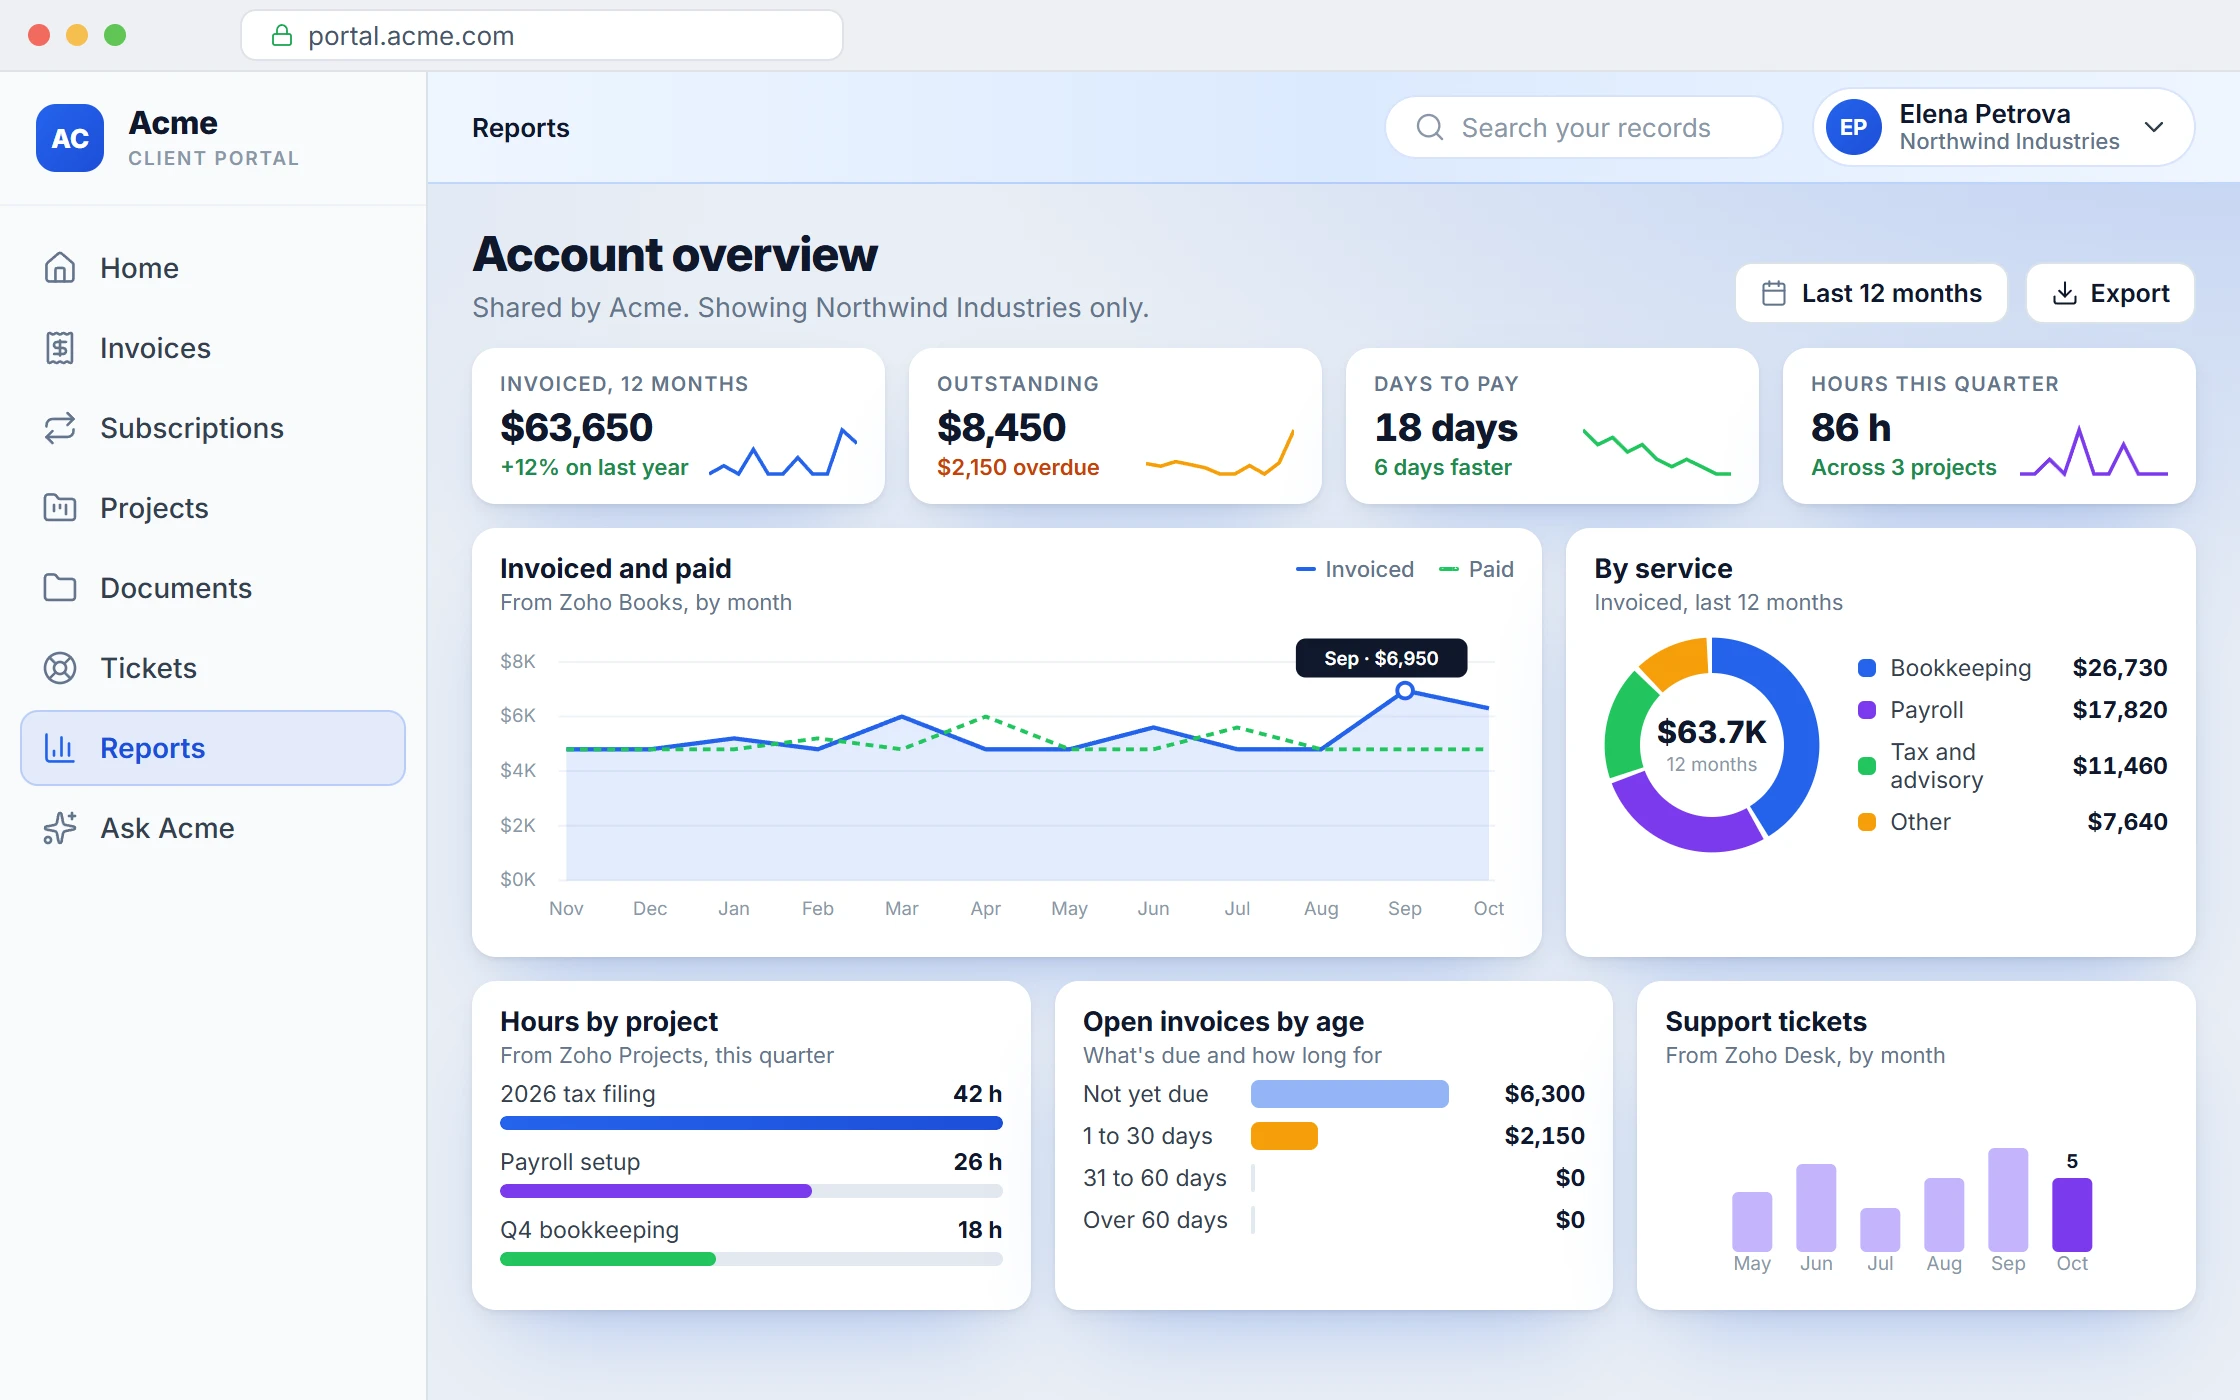
Place a report on any portal page and each client sees it filtered to their own records. They can change the date range, click a bar or a slice to filter the rest, open the record behind a row and keep the views they use every week.
- Date ranges and filters clients can change
- Click a bar to filter, click a row to open the record
- The AI client assistant can answer from the reports you've shared
Scheduled, exported and logged
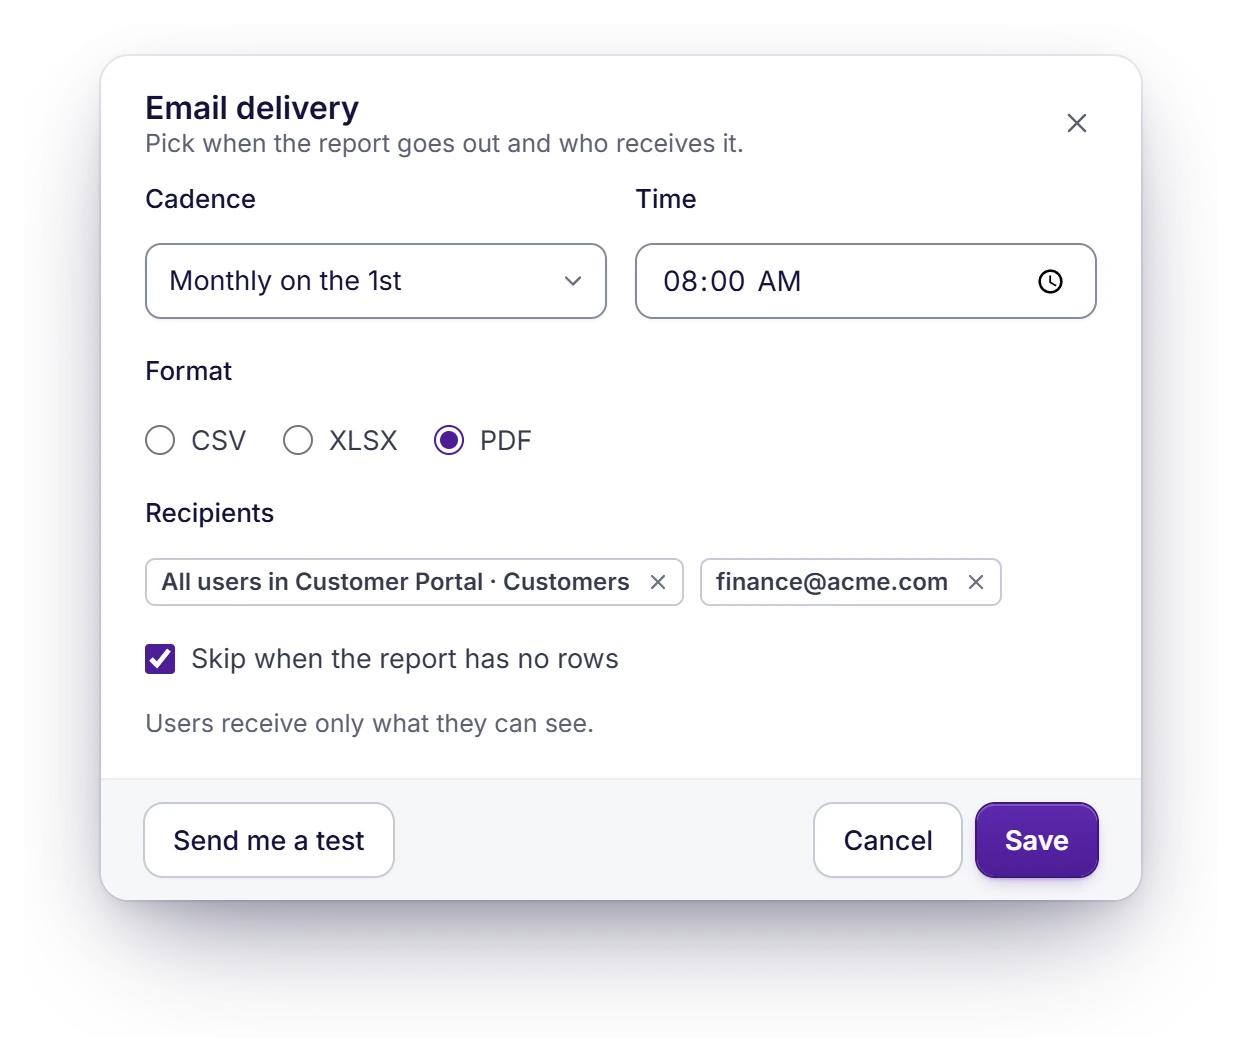
Email a report on a schedule to the people who need it, in the format they work in, and skip the email when there's nothing to report. Each recipient gets a copy with only their own rows, and every export is written to the audit log.
- CSV, XLSX and PDF
- Daily, weekly, monthly or quarterly, with only each recipient's rows
- Every export in the audit log
Security built in
Bringing your data together only works if it's kept safe, and if each client sees only their own.
How we protect your data- A database of your ownEach customer's data is kept apart, never in a shared table.
- Only their own recordsEach client sees their data, down to the field, and nothing else.
- Two-factor sign-inPortal users and your team can sign in with an authenticator app.
- A full audit logEvery change, sign-in, export and restore is recorded.
See your own portal in a demo
Start a 7-day free trial, no credit card needed, or book a demo and we will build a page on your own data while you watch.
Have a question first? Send us a message